Usage
DISCLAIMER: The information and code provided in this package is for educational and informational purposes only and is not intended to be used as financial advice. The authors of this package are not responsible for any financial decisions made based on the use of this package. Always do your own research and consult with a licensed financial advisor before making any investment decisions.
The following code script demonstrates how to use Cointables to backtest the MACD signal against the market for a specific cryptocurrency, and plot the resulting data using the mplfinance package.
NOTE: You will need to install mplfinance independently for the below plotting capabilities. In addition, you will need to make a separate config.py file in the same directory where you define 2 variables, API_KEY and API_SECRET, your Binance API keys in string format.
import cointables as coin
import mplfinance as mpf

from binance.client import Client
import config
import tests.calcs as calcs

# Create a new instance of the Chart class with the specified client, coin, market, and candle settings
chart = coin.Chart(client=Client(config.API_KEY, config.API_SECRET))
chart.coin = 'ETH'
chart.market = 'USDT'
chart.candles = '1w'

# Retrieve price data from Binance using the Chart class
chart.coinGET()
print(chart.dataframe)

# Perform MACD calculations and strategy computations
df = calcs.rollstats_MACD(chart.dataframe)
df = calcs.regimes(df)
df = calcs.strat_compute(df)

# Define addplots for the mplfinance plot
ap = [
    mpf.make_addplot(df['market'], panel=1, type='line',
                     ylabel='strategy', secondary_y=False),
    mpf.make_addplot(df['strategy'], panel=1,
                     type='line', secondary_y=False),
    mpf.make_addplot(df['signal'], panel=2, type='scatter',
                     markersize=100, marker='v', ylabel='signal'),
    mpf.make_addplot(df['regime_old'], panel=2,
                     type='line', ylabel='regime'),
    mpf.make_addplot(df['regime'], panel=2, type='line', ylabel='regime'),
]

# Define the style for the mplfinance plot
s = mpf.make_mpf_style(base_mpf_style='nightclouds', figcolor='#222')

# Plot the data using mplfinance
mpf.plot(df, title=chart.coin + chart.market + " ({} candles) {}".format(chart.candles, title_extra),
         mav=(12, 26), type='candle', ylabel='Candle', addplot=ap, panel_ratios=(2, 1), xlabel=chart.message,
         figratio=(1, 1), figscale=1.5, style=s)
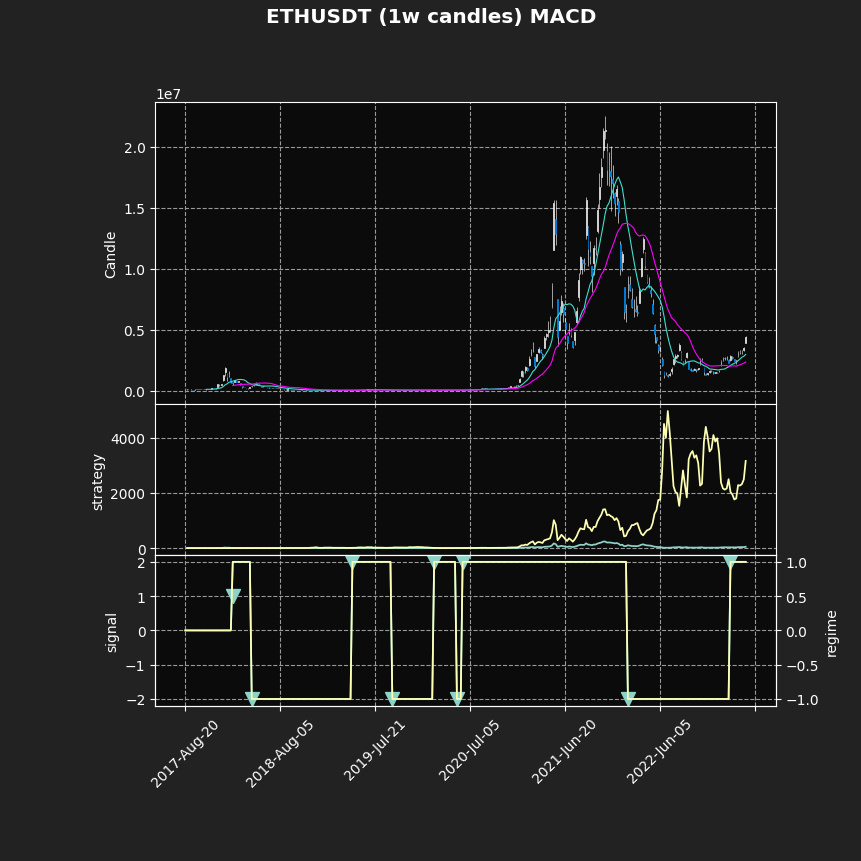
The resulting plot shows the backtest of the MACD signal against the market for the specified cryptocurrency.